
Staring at all your business data can feel like you're trying to pilot a ship through a dense, disorienting fog. You know your destination is out there, but every direction looks the same. There is, however, a clear way forward.
Key Performance Indicators (KPIs) for small businesses are the instruments that cut through that mist. They give you clear, measurable values that show you, without a doubt, how well you're hitting your most important goals. Think of them as the vital signs that guide your decisions and fuel real, sustainable growth.
What Are KPIs and Why Do They Matter?

Imagine your business is a car on a cross-country road trip. Would you even think about starting that journey without a dashboard? Of course not. You need to see your speed, your fuel level, and your engine temperature—the critical information required to reach your destination safely and efficiently.
Key Performance Indicators serve that exact same purpose for your small business.
These aren't just random numbers or vanity metrics that make you feel good. They are carefully chosen data points that act as your business's real-time vital signs. They tell you where you are, where you're headed, and how fast you're getting there. Without them, you’re basically driving blind, making decisions based on gut feelings instead of hard evidence. This is precisely why setting up the right KPIs is so fundamental to your long-term success.
Before we dive deeper, let's break down the main types of KPIs you'll encounter. Most metrics you'll track will fall into one of these four core categories.
Core KPI Categories for Small Businesses
| KPI Category | What It Measures | Example Metric |
|---|---|---|
| Financial | The overall monetary health and profitability of your business. | Net Profit Margin |
| Customer | How customers interact with and feel about your business. | Customer Lifetime Value (CLV) |
| Marketing & Sales | The effectiveness of your efforts to attract and convert leads. | Customer Acquisition Cost (CAC) |
| Operational | The efficiency of your internal processes and daily activities. | Employee Turnover Rate |
Understanding these categories helps you build a balanced dashboard that gives you a complete picture of your business's health, not just a single, isolated number.
Turning Goals into Actionable Steps
KPIs are what transform abstract goals like "increase revenue" or "improve customer happiness" into tangible, trackable targets. They create a clear, undeniable link between your day-to-day activities and your biggest strategic objectives. It’s this connection that truly empowers you to make sharp, informed decisions.
For example, instead of just hoping for more sales, you could start tracking specific KPIs like:
- Customer Acquisition Cost (CAC): How much you spend, on average, to land a new customer.
- Average Order Value (AOV): The average amount each customer spends when they make a purchase.
- Website Conversion Rate: The percentage of website visitors who complete a desired action, like buying a product.
By keeping a close eye on these numbers, you can pinpoint exactly which part of your sales funnel is leaking. A high CAC might signal that your advertising isn't hitting the mark, while a low conversion rate could point to a frustrating user experience on your website.
A National View on Performance
Tracking performance isn't just an internal exercise; it's how the health of the entire small business economy is measured. National surveys analyze trends in revenue, profitability, and employment to see how businesses are doing on a larger scale.
These reports often break down data by industry, location, and owner demographics, revealing fascinating patterns of success and struggle. To see how these key performance indicators for small business play out across the country, check out the U.S. Small Business Credit Survey's Main Street Metrics report on fedsmallbusiness.org.
Your Financial Health Scorecard
When it comes to your business, you have to follow the money. These aren’t just numbers for your accountant; they’re the pulse of your business. They tell you if you're thriving, just surviving, or if you need to make a change—fast. Getting a real handle on your financial health is the first step to making smarter decisions on everything from pricing to expansion.
Let's say you own a small, bustling coffee shop. You’re busy pulling shots and managing baristas, but how do you really know if the business is healthy? This is where a few key financial metrics can paint a clear, actionable picture.
Gross Profit Margin: The Latte Test
Your Gross Profit Margin tells you exactly how much profit you make on each item you sell, before you even think about overhead like rent or staff salaries. It’s a direct measure of how well your pricing and production costs are working together.
For your coffee shop, this KPI answers a simple question: "How much actual money am I making on one latte?"
Imagine a latte sells for $5.00. The coffee, milk, and cup for that single drink cost you $1.50. That leaves you with a gross profit of $3.50.
To get the margin, you just divide that profit by the price: ($3.50 / $5.00) x 100 = 70%.
A high Gross Profit Margin is a great sign—it means you have a healthy markup. If that margin is low or, even worse, shrinking, it’s a massive red flag. It’s telling you that either your costs are getting out of control or your prices are too low. It's a critical tool for dialing in your pricing.
Net Profit Margin: The Big Picture
While Gross Profit Margin is perfect for looking at a single product, your Net Profit Margin tells you if the entire business is actually profitable after all the bills are paid. This includes everything—rent, utilities, marketing, and barista wages. It’s the ultimate report card for your company's financial health.
This KPI goes beyond a single latte and asks the real question: "After paying for literally everything, did my coffee shop make any money this month?"
Net profit is the bottom line. Calculated by subtracting your total expenses from your total revenue, it’s the fundamental metric showing whether your business model is sustainable. A strong net profit margin—found by calculating (Net Profit / Revenue) x 100%—is a powerful indicator of how efficient your operations are and how well you manage costs. For a deeper dive, check out this excellent breakdown of small business KPIs on blog.wask.co.
This is where you connect the dots between your sales and your spending. A high net profit margin shows you’re a master at controlling your operational costs. If this number looks low even when sales are strong, it's time to start plugging the leaks. Our guide on how to reduce business expenses offers practical strategies you can use right away. This is, without a doubt, one of the most vital key performance indicators for any small business.
Gauging Customer Loyalty and Satisfaction
If strong financials are the engine of your business, then happy and loyal customers are the fuel. Getting someone to buy from you once is just the beginning; creating a reason for them to come back is what builds a truly sustainable—and profitable—business. This is where customer-centric key performance indicators for small business come into play, giving you a real measure of satisfaction and loyalty.
Imagine you run two different marketing campaigns. The first one brings in a flood of new buyers, but almost none of them ever buy from you again. The second campaign attracts fewer new customers, but a huge portion of them become repeat buyers for years to come.
On the surface, that first campaign might look like a roaring success. But it's really an expensive, revolving door. The second campaign, however, is building a reliable foundation for long-term growth. Tracking the right KPIs is how you spot this crucial difference.
The True Value of a Customer
Two of the most powerful metrics for seeing your customers clearly are Customer Acquisition Cost (CAC) and Customer Lifetime Value (CLV).
- Customer Acquisition Cost (CAC): This is simply the total you spend on sales and marketing to land a single new customer.
- Customer Lifetime Value (CLV): This KPI predicts the total profit your business can expect from any given customer over the entire time they do business with you.
The magic happens when you put these two numbers side-by-side. A healthy business makes sure its CLV is significantly higher than its CAC. Think about it: if you spend $100 to get a customer who only ever spends $50 and disappears, you've got a serious leak in your bucket. But if that same $100 brings in someone who spends $500 over several years, you've found a winning formula.
Listening to Your Customers at Scale
Beyond the numbers, how do you measure something as fuzzy as "happiness"? The Net Promoter Score (NPS) offers a simple yet surprisingly powerful way to do just that. It boils down to a single, critical question you ask customers: "On a scale of 0-10, how likely are you to recommend our business to a friend or colleague?"
Their answers sort them into three distinct groups:
- Promoters (9-10): These are your loyal fans who keep buying and tell others to do the same.
- Passives (7-8): They're satisfied enough, but not enthusiastic. They're easily swayed by competitors.
- Detractors (0-6): These are unhappy customers who can actively hurt your brand with negative word-of-mouth.
You calculate your NPS by subtracting the percentage of Detractors from the percentage of Promoters. This single number gives you a clear snapshot of customer sentiment and loyalty that you can track over time.
This feedback is pure gold. It gives you a direct line into what you’re doing right and, more importantly, where you need to get better. A great NPS is often the direct result of excellent service, a topic we dive into in our guide on customer service for small business. When you listen and act on this feedback, you can start turning Detractors into Passives, and Passives into your most passionate Promoters.
Using KPIs to Make Real Business Decisions
Here's the thing about KPIs: just tracking numbers in a spreadsheet does absolutely nothing for your business. The real magic happens when you use them to make concrete, intelligent decisions. They’re the bridge between abstract data and tangible improvements in how you operate day-to-day.
Think of your KPIs as a diagnostic tool. A doctor doesn't just write down your blood pressure and send you on your way; they use that number to figure out a treatment plan. In the same way, your KPIs are meant to diagnose problems and guide your next move.
It's about shifting your focus from just working to working on the right things. A study from the KPI Institute found that 68% of companies saw a real improvement in performance after getting serious about their KPIs. This isn’t a surprise—when you know what to fix, you stop wasting time.
From Data to Actionable Insights
Let’s bring this down to earth. Imagine you run a small e-commerce store. You decide to track Order Fulfillment Time—the total time from when a customer clicks "buy" to when the package lands on their doorstep.
Suddenly, you notice that number starting to creep up. That’s your signal. It's time to investigate. You can drill down into the data and start asking questions:
- Is the warehouse crew taking too long to pack orders?
- Is our shipping carrier hitting delays?
- Are we constantly running out of stock on popular items, creating backorders?
By answering these questions, you pinpoint the real bottleneck. You can then fix that specific problem, which improves customer satisfaction and protects your hard-earned reputation. See how one KPI can set off a chain reaction of positive changes?
The goal isn’t just to collect data, but to ask what that data is telling you to do next. An effective KPI always prompts a question, and the answer to that question should be an action.
Building a Balanced View of Performance
Another trap to avoid is getting fixated on a single metric, like monthly revenue. I get it, revenue is exciting. But a narrow focus can be misleading—and sometimes, even dangerous.
Think about a consultant who only tracks their income. They might feel great after a high-earning month, but what if their Website Conversion Rate has quietly plummeted? That metric—the percentage of site visitors who actually become clients—might be screaming that there's a huge problem with their online marketing.
By looking at both financial and marketing metrics, the consultant gets the full picture. This "balanced scorecard" approach stops you from celebrating short-term wins while ignoring long-term threats. It ensures your efforts to increase business revenue are sustainable and not coming at the cost of your operational health or marketing engine.
Choosing the Right KPIs for Your Business
With a universe of potential metrics you could track, it’s frighteningly easy to get lost in the data. This feeling of “analysis paralysis” is something every business owner runs into, but there’s a straightforward way to cut through the noise. The secret is to stop obsessing over metrics first and start with your most important business goals instead.
This goal-first approach is the only way to ensure that every single key performance indicator for small business you track is meaningful. It keeps you focused on what actually moves the needle, steering you away from vanity metrics that look good on paper but do nothing for your bottom line.
Start With Your Business Goals
The process is surprisingly simple: begin by clearly defining a core business objective. This can't be some vague wish like "grow the business." It needs to be a specific, measurable target you can aim for.
From there, you just work backward. What actions do you need to take to hit that goal? And which KPIs will tell you if those actions are working?
A KPI is only useful if it measures your performance against a specific, critical business goal. If a metric doesn't connect directly to an objective, it's just noise.
Let’s walk through a quick example for a service business, like an HVAC company:
- Core Business Goal: Increase repeat customer business by 20% over the next six months.
- Actions Needed: We need to improve our post-service follow-up and make sure customers are genuinely happy with our work.
- KPIs to Track: Customer Retention Rate and Net Promoter Score (NPS).
See how that works? This simple framework turns an abstract ambition into a clear, actionable plan. It gives you a focused dashboard that tells you exactly how you’re doing against the targets that really matter.
Matching Goals To The Right KPIs
To make this even more practical, let's look at how to pair common small business goals with the KPIs that measure them. This helps you see how different objectives require different sets of metrics for a complete picture of your performance.
The infographic below shows how high-level financial goals are measured by specific KPIs.
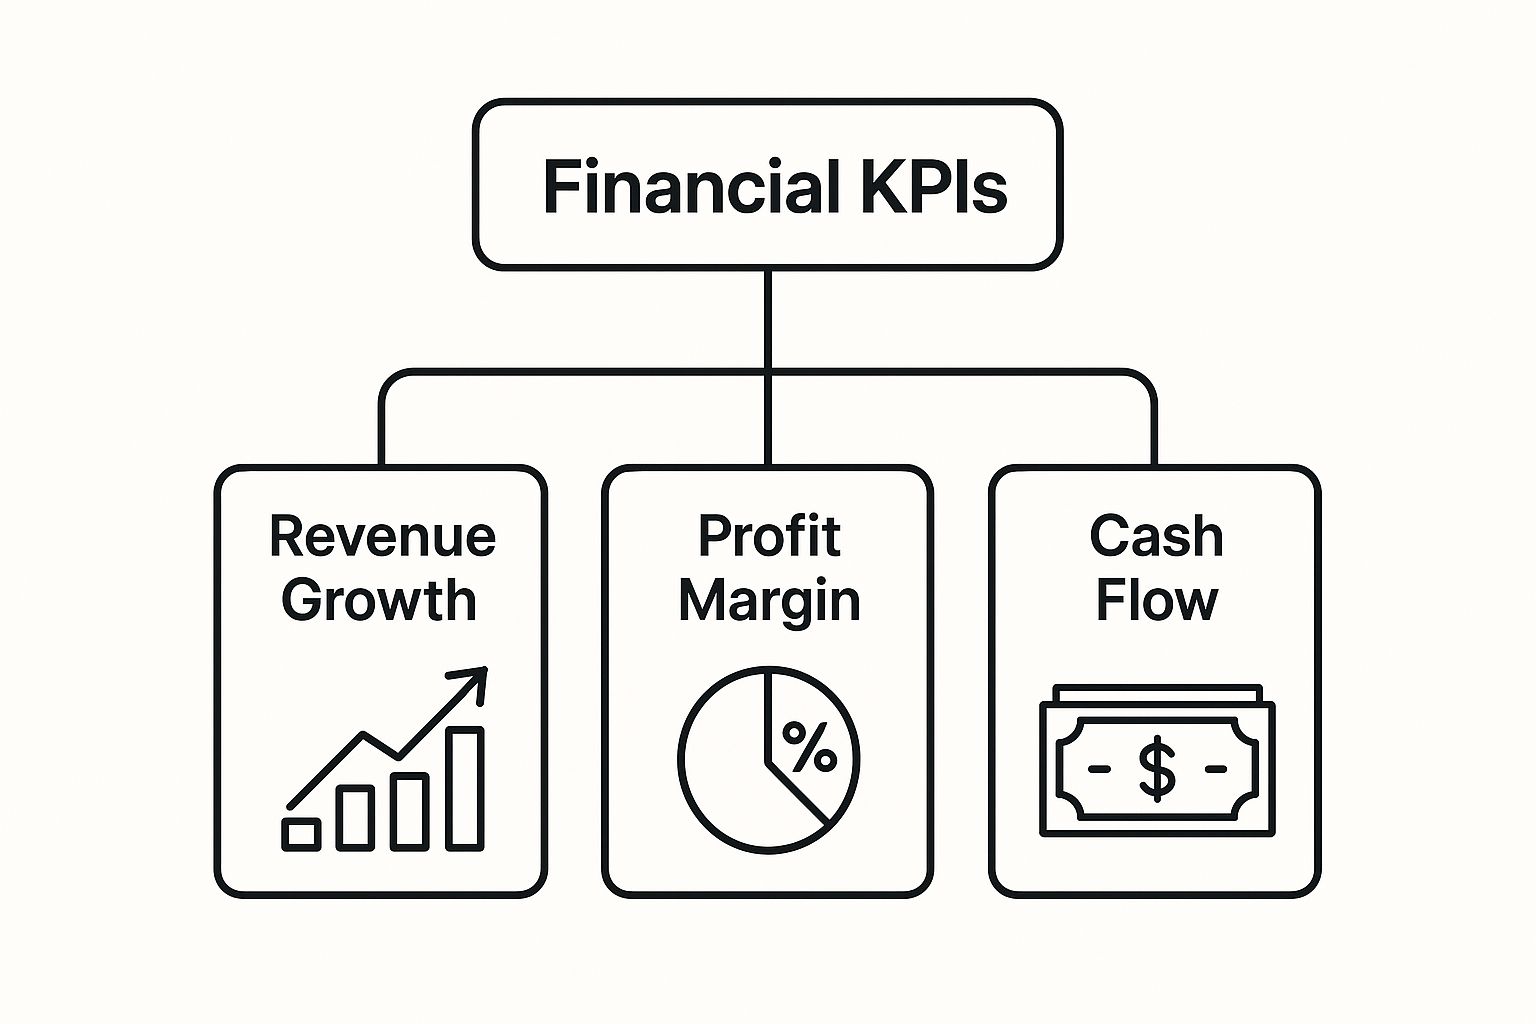
This hierarchy shows that to understand your overall financial health, you need to track distinct indicators like revenue growth, profit margin, and cash flow together. One metric alone won't give you the full story.
To expand on this, the table below connects various business goals with the KPIs that bring them to life. This is where the magic happens.
Matching Business Goals to Relevant KPIs
| Business Goal | Key Result Needed | Primary KPI to Track | Secondary KPI |
|---|---|---|---|
| Increase Profitability | Generate more profit from each sale | Gross Profit Margin | Average Transaction Value |
| Boost Online Sales | Convert more website visitors into buyers | eCommerce Conversion Rate | Cart Abandonment Rate |
| Improve Customer Loyalty | Get existing customers to buy again | Customer Retention Rate | Customer Lifetime Value (CLV) |
| Drive More Web Traffic | Attract more qualified visitors to the site | Organic Search Traffic | Keyword Rankings |
| Grow Email List | Turn website visitors into subscribers | Email Subscription Rate | Lead Magnet Download Rate |
| Enhance Customer Service | Solve customer issues faster and better | Average Resolution Time | Customer Satisfaction (CSAT) Score |
Notice how a primary KPI is supported by a secondary one? This layered approach is critical because it gives you context and helps you understand the why behind the numbers. It stops you from making decisions based on incomplete data.
This structured method ensures that every metric you watch serves a distinct purpose, guiding your strategy and helping you make smarter, more confident decisions.
Putting It All Together with Real-World Data
Tracking your own key performance indicators for small business is a huge step. But the real magic happens when you hold your numbers up against what's happening in the wider world. This is how your metrics go from being simple report cards to a genuine strategic tool. It lets you peer beyond your own four walls to understand the bigger economic currents moving your customers.
Think of it this way: your business KPIs tell you what is happening, but external data helps you understand why.
Let's say you're keeping a close eye on your Average Ticket Size, a vital KPI for almost any retail or service business. You notice it's started to dip, just slightly. On its own, that’s cause for a little worry. But what happens when you look at it next to some real-world market reports?
Connecting Internal and External Data Points
Recent economic data can tell you a ton about how resilient people are feeling and where they're choosing to spend their money. Many indexes that track small business performance show that even when overall sales are up, the types of things people buy can change dramatically.
For example, national sales data might reveal a surge in spending on essentials while people pull back on discretionary items. Trends like these, often driven by things like inflation, give your own numbers some much-needed context. Diving into detailed reports can offer a real-time snapshot of how other businesses are navigating these same pressures. For a granular look at these dynamics, you can explore more about small business sales indices on theshopmag.com.
By layering this external intelligence over your own data, you can make smarter, more proactive decisions. A dip in your average ticket size, when viewed next to a national trend of smaller, more frequent purchases, is no longer a mystery.
This kind of insight is powerful. It allows you to pivot your strategy instead of just reacting to a problem. You could:
- Tweak your marketing to focus on value and affordability.
- Create product bundles to nudge customers toward slightly larger purchases.
- Shift your inventory to meet the growing demand for essentials.
This is how you level up from reactive problem-solving to proactive, data-informed leadership. It's the key to staying agile and competitive, no matter what the economy decides to throw your way.
Still Have Questions About Business KPIs?
That's completely normal. Even after you get the hang of the core ideas, a few questions always seem to pop up. Let's walk through some of the most common ones I hear from small business owners.
How Many KPIs Should a Small Business Track?
Less is almost always more. Seriously.
It’s tempting to want to measure everything, but that’s a fast track to getting overwhelmed. Start by picking just one or two powerful KPIs for each core part of your business—think financials, customers, and operations.
A clean, simple dashboard with a total of 5-10 indicators is infinitely more useful than a cluttered one that just creates noise. You're looking for signal, not static. The whole point is to monitor what directly impacts your biggest goals, not to drown in a sea of data. And remember, these aren't set in stone. As your business evolves, your KPIs should, too.
What Are the Best Free Tools for Tracking KPIs?
You absolutely do not need to spend a fortune on fancy software, especially when you're starting out. Some of the best tools for the job are completely free.
- Spreadsheets: Never underestimate the power of a well-organized spreadsheet. Tools like Google Sheets or Microsoft Excel are perfect for keeping tabs on your financial and operational KPIs.
- Website Analytics: If you do anything online, Google Analytics is non-negotiable. It's the industry standard for a reason—and it's free. It will give you all the marketing and sales metrics you could ever need.
- Customer Feedback: Want to track something like a Net Promoter Score (NPS)? The free plans on tools like SurveyMonkey or Typeform are great for gathering that kind of customer data.
What Is the Difference Between a Metric and a KPI?
This is a really important distinction, and it trips a lot of people up. Here’s the simplest way to think about it: all KPIs are metrics, but not all metrics are KPIs.
A metric is just a number—any quantifiable measurement you can track. Think of the total number of followers on your company's Instagram page. It's a number. A Key Performance Indicator (KPI), on the other hand, is a metric you've hand-picked because it directly measures your progress toward a critical business goal.
Your follower count is an interesting metric, sure, but it's what we'd call a "vanity metric." It might make you feel good, but it doesn't tell you much about the health of your business.
A real KPI, like 'customer acquisition cost from social media,' is where the magic happens. That number tells you if your marketing dollars are actually turning into profitable customers. It's a metric that's tied directly to your bottom line, and that's what makes it key.
